Integrated Media Monitoring System MajorDomus is a specialized tool, consisting of network and measurement infrastructure as well as data servers with multi-platform software, so available practically on any operating systems, the basic tasks of which include:
- Ongoing monitoring of the state of the network and measuring devices as well as data collection.
- Identification and location of alarm events as well as immediate notification of them.
- Analysis of readings in given periods of time and sharing of collected data in the form of reports and export of these data to CSV format that enables their presentation in any spreadsheet.
Connecting media monitoring systems
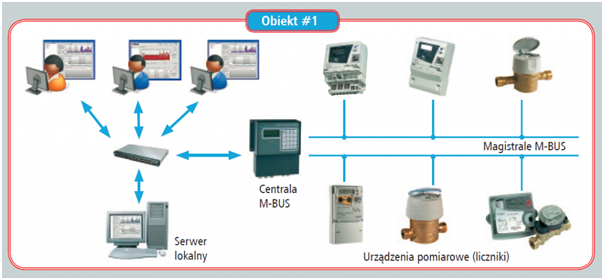
The system enables the connection of virtually any measuring meter that enables communication with it. This gives virtually unlimited possibilities for monitoring the consumption of not only typical media such as heat, water, electricity or gas, but practically any gaseous, liquid and semi-liquid substances.
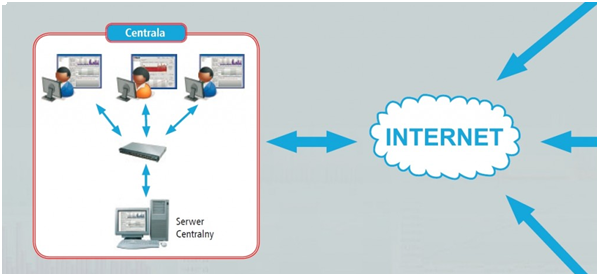
Media monitoring system – local - distracted
System operation can take place both as part of a local and distributed structure, which means the possibility of ongoing monitoring and collection on servers of data from facilities located virtually anywhere in the world, and for media monitoring system operators virtually unlimited access to this data, without the need to use specialized system applications, only using any web browser.
Media monitoring system software
The software, whose basic interface from the user's point of view are M-Visio Center, M-Visio Local, ensures complete security in collecting and accessing data thanks to the use of advanced encryption algorithms, practically preventing both the reconstruction of the copied data and unauthorized access to it.
M-Visio Centre and Local
The M-Visio Center and Local applets are used to analyze meter readings and to prepare reports on the operation of these devices. The difference between them is that the M-Visio Center applet is used to analyze the meter readings included in all local networks and subnets that make up the media monitoring system, while the M-Visio Local applet is used to analyze the meter readings within the local network. The capabilities of both applets are similar, but due to the supported structure they differ in the graphical interface.
Working with applets takes place via a web browser after logging in and is possible in one of two modes:
- In graph mode
- In reports mode
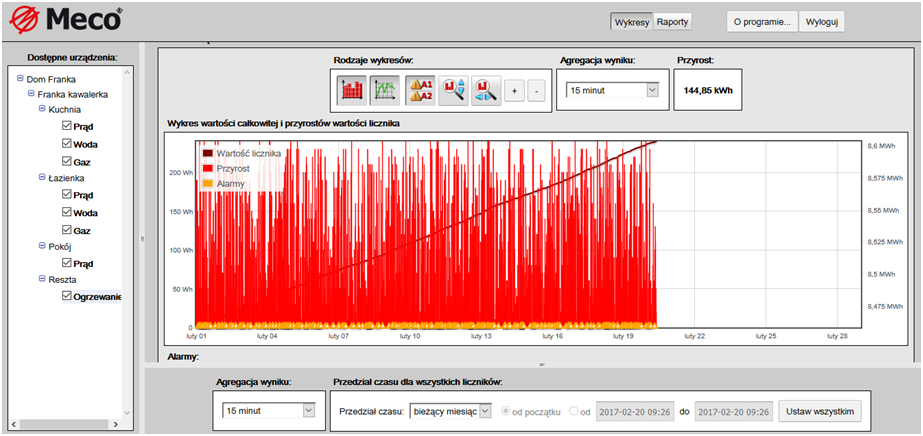
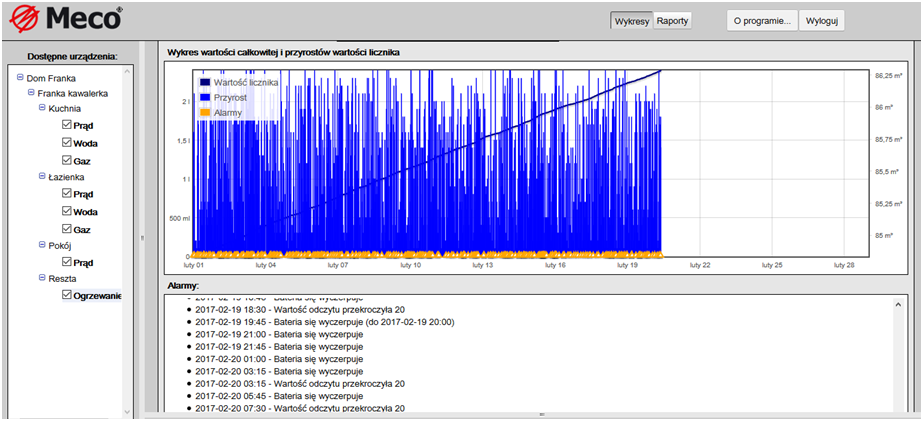
In the graphs mode, selecting a counter allows you to open the counter panel in the main part of the window. Applets enable simultaneous opening of graph panels for many meters by simply selecting the meters of interest from the list. The counter panel is divided into two parts: the graph area and the additional information area.
The following chart types are available in the charts area:
- Increments chart - a bar chart of increments values in a given interval.
- Readings graph - a line graph for individual reading points.
- Alarm history - a list of alarm events for a given meter in a given period.
- Fixed width - allows you to define the width of the bars.
- Multiple selection is possible - then the windows are drawn one by one.
System information is also presented in the charts area, e.g. alarms with date and time as well as additional information on the presented graph, including the time range. The applet allows you to select a date range with an accuracy of 1 minute. Pre-defined ranges are available:
- Current day, current week, and current month.
- Last day, last week, last month.
- Any range can be defined with manual setting. The counter panel also provides additional information, grouped as follows:
- Details - details of the counter such as: counter type, medium, manufacturer and description.
- Info - current reading and a list of the latest alarms and the consumption value for the selected period.
The settings of individual panels of meters are reflected in the created detailed reports that reflect the work of each meter separately.
The general report contains a summary of individual meters in the form of a readable table with a final summary. Working with applets takes place via a web browser after logging in and is possible in one of two modes:
- In graph mode
- In reports mode
In the graphs mode, selecting a counter allows you to open the counter panel in the main part of the window. Applets enable simultaneous opening of graph panels for many meters by simply selecting the meters of interest from the list. The counter panel is divided into two parts: the graph area and the additional information area.
The following chart types are available in the charts area:
- Increments chart - a bar chart of increments values in a given interval.
- Readings graph - a line graph for individual reading points.
- Alarm history - a list of alarm events for a given meter in a given period.
- Fixed width - allows you to define the width of the bars.
- Multiple selection is possible - then the windows are drawn one by one.
System information is also presented in the charts area, e.g. alarms with date and time as well as additional information on the presented graph, including the time range. The applet allows you to select a date range with an accuracy of 1 minute. Pre-defined ranges are available:
- Current day, current week, and current month.
- Last day, last week, last month.
- Any range can be defined with manual setting. The counter panel also provides additional information, grouped as follows:
- Details - details of the counter such as: counter type, medium, manufacturer and description.
- Info - current reading and a list of the latest alarms and the consumption value for the selected period.
The settings of individual panels of meters are reflected in the created detailed reports that reflect the work of each meter separately.
The general report contains a summary of individual meters in the form of a readable table with a final summary.
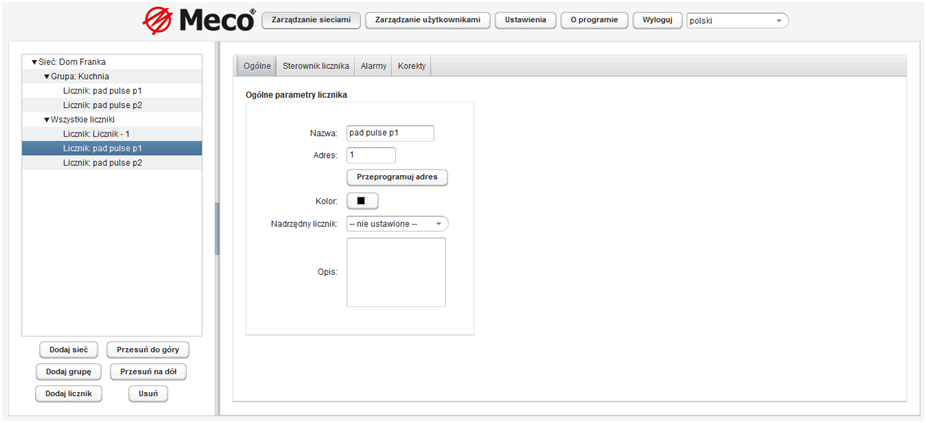
M-Admin software in media monitoring system
The M-Admin Center and Local applications are used to define operating parameters and users of the media control systemfor